Kafka Internal Architecture.
Inside the Broker - How the data plane works, control plane works, Compaction works, Key based topic retention works through the compaction.
Durability, Availability and Ordering Guarantees.
Consumer Group Protocol.
Transactions.
Tiered Storage.
Elasticity.
Geo-Replication.
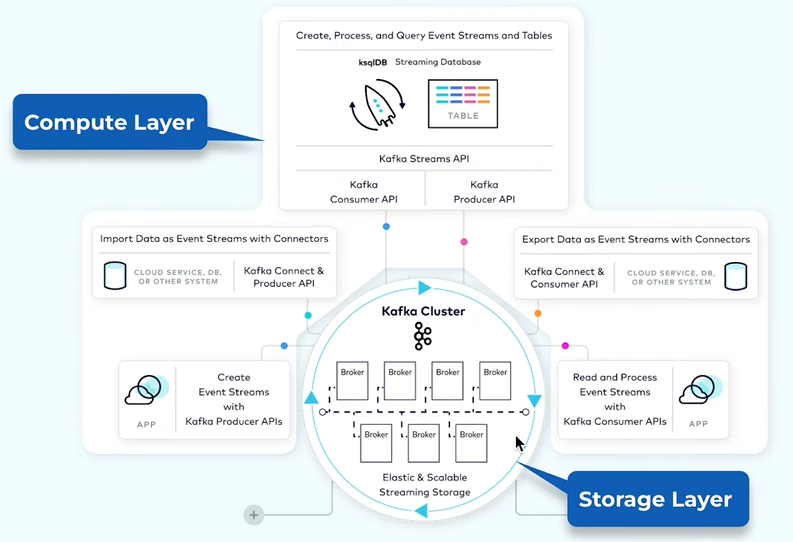
The core is the storage system showing in the bottom. It stores the data efficiently as an event. It is also designed as a distributed system so if there is a need to increase the storage it will accommodate its storage.
There are 2 primitive APIs for accessing the data in the storage - Producer API and Consumer API.
There is Connect API that is to integrate Kafka with the ecosystem. There is the source and sink.
There is another high level API is the Processing one is the Kafka Stream and another one is more declarative called KSQL.
The storage and the processing needs are different and it can be scaled out independently.
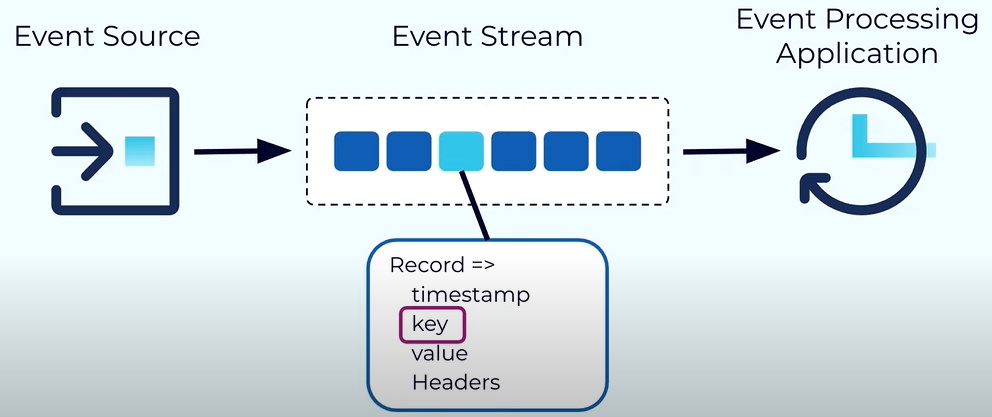
Event is like anything that happens into the world like purchasing clicking on a link or any orders.
Each event in the Kafka is modelled as a Record. Each record has a timestamp, key, value and optional headers.
The payload is included into the values.
The key typically has three main uses - It used for enforcing ordering, collocating the data that have the same property and it can be used for key retention.
Both the key and the values are actually the byte array and that gives users the advantage to encode the data using their favorite serializer.
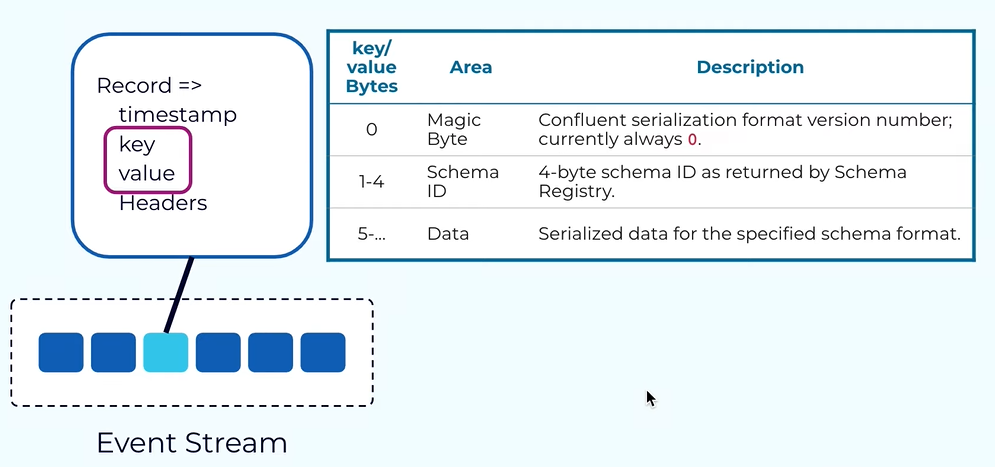
Integrated Kafka with confluent Schema Registery, using the Avro serializer then the value of the key and the value will look like the one shared in image.
It will start by the magic byte then the schema id and the data using the Avro encoding.
Kafka Topic - Topic is like the db table. It is the concept of organizing the event of the same type together.
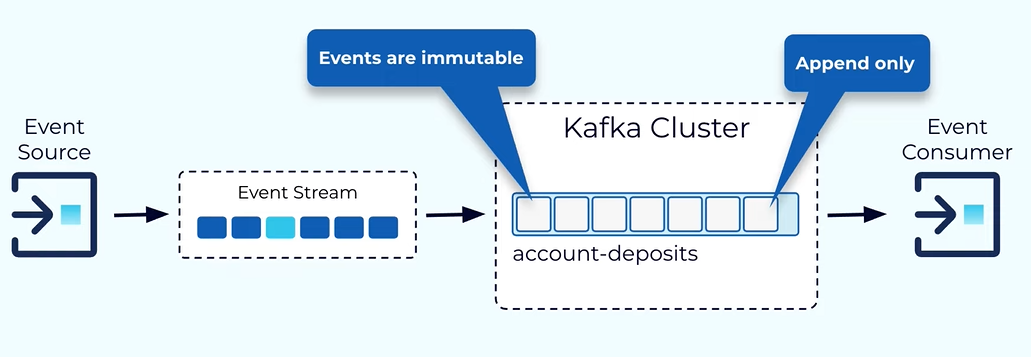
When published the event we have to specify that which topic we want to add the data and also while reading we have to specify the list of the topic we want to read the data.
All the events published to the topic is immutable.
Kafka is design on the distributor system so we need a way to distribute the data within the topic Into different node within that Kafka cluster this is achieved by the help of partitions.
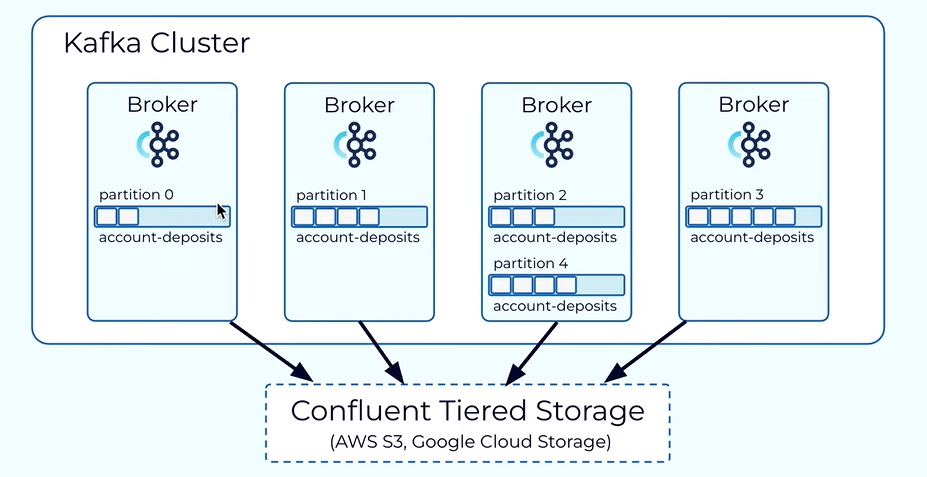
When creating the topic you have to mention the partitions and partition is the unique data distribution and for a given partition the data is typically stored within a single broker in the Kafka cluster.
Partition is also the unit of parallelism’s data from the partitions can be accessed in parallel and also in one partition data can be consumed and produced at the same time.
Introduction to the data plane.
Within the Kafka cluster there is a separate control plane and data plane.
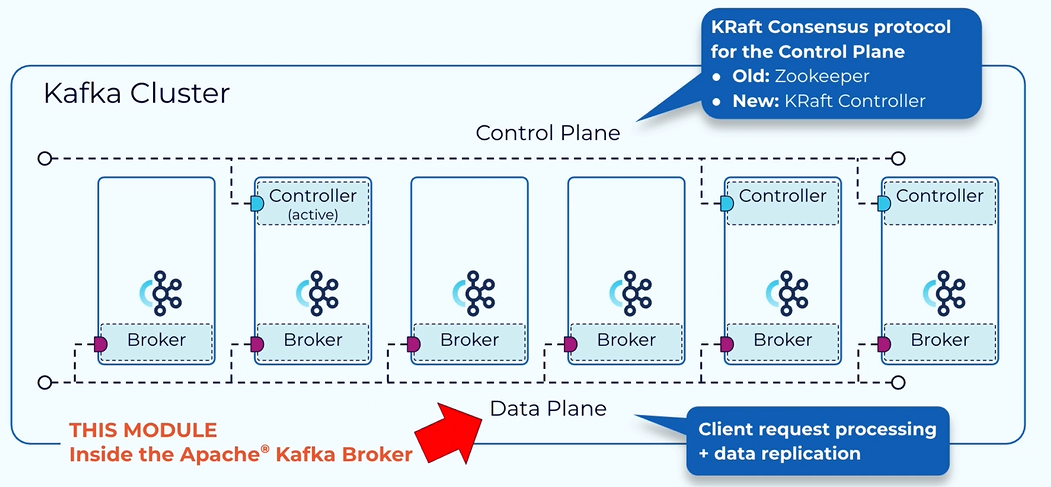
The control plane handle meta data and the data plane handle the actual data.
There are two main type of request each broker type is handling - The producer request from the producer and the fetch request from the consumer.
Producer Request.
The Producer client starts by sending a record and the producer library will use a pluggable partitioner to decide the partition in the topic to put the data.
Key present then the default partitioner assigner will hash the key and store into the particular topic and Key not present then the record will be selected in a round robin way.
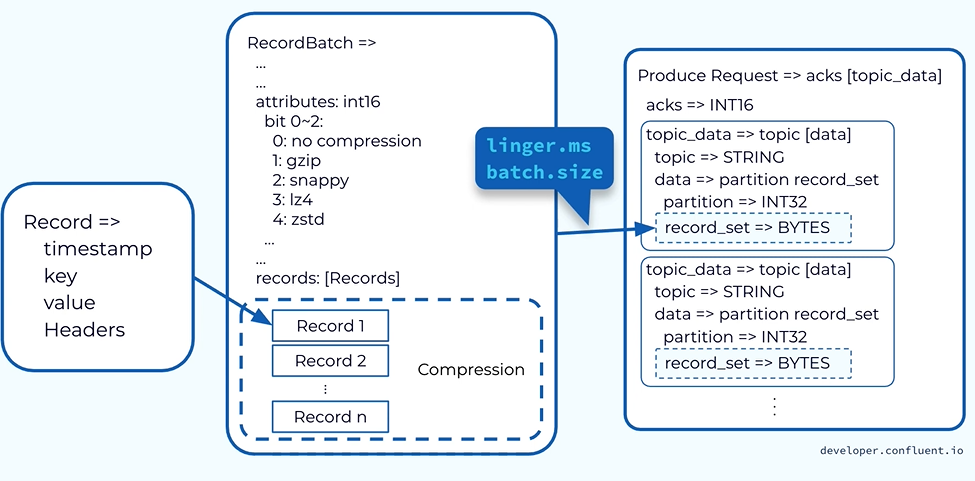
Sending record as itself is not efficient and it has many overhead the producer library buffer all those data in the in memory called record batches. Accumulating data into the record batches will allow the compression field compressions of a bunch of records is much more efficient.
Producer has the control of men that record my batches to send to the broker.
It is contributing to properties the time or the size.
Once enough time or enough data has been accumulated to the record batches it will be drain and form a produce request. The produce requests sent to the corresponding broker.
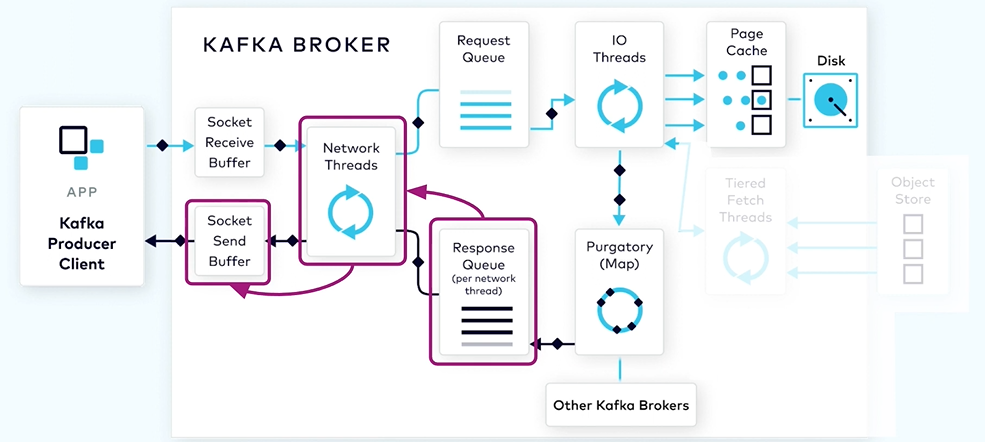
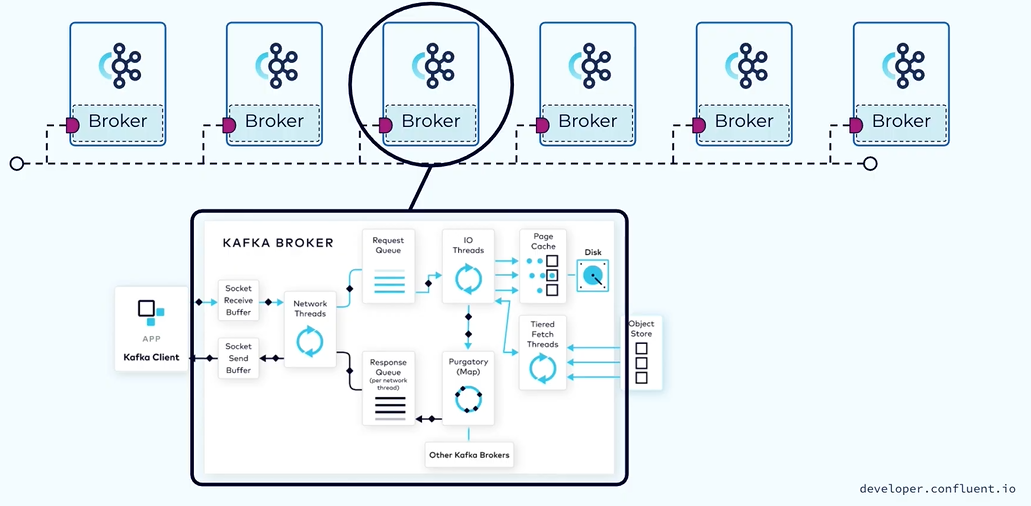
The produce request will first land in the socket receive buffer on the broker. The network thread will pick up a particular client request it will stick to the particular client.
Each of the network thread is used to multiplex across multiple clients, the network thread is designed to only do work that is lightweight. In most of the cases the network thread takes bytes from the socket buffer and forms a produce request object and put in the shared request queue.
The request to be picked up by the second main pool in Kafka called IO thread. Unlike the network thread each IO thread can be used to handle request from any client.
All of the IO thread will be diving into the shared request queue and they will be grabbing the next request.
The IO thread will handle the produce request by first valuating the CRC of the data associated with the partition and then it will append the data associated with the partition to the data structure called commit log.
The commit log is organised on disk in a bunch of segments each of the segment has two main parts one is the actual data and the second one is the index structure.
The index structure provides the mapping from the offset to the position of this record within the .log file.
By default the broker will only acknowledge the producer request once the data is fully replicated across other brokers as it rely on replication to serve the purpose of durability.
While waiting for the data to be fully replicated we do not want to tie up this io thread as it is limited so it’s those pending produce requests into a data structure called Purgatory like a map.
After that IO thread can be freed up Can be used to process the next request.
Once the data for the pending request is fully replicated the pending produce request will be taken out of purgatory then the response will be generated and will be put into the corresponding request response queue for the network thread.
From there the network thread will pick up the generated response and will send the response data into the sent socket buffer.
The network thread is also enforcing an ordering of the request coming from with the single client. It only takes one request from the client at a time And only after completing of this request when all the bytes for the response have been sent the network thread will be able to take up the next request from that client.
Consumer Request.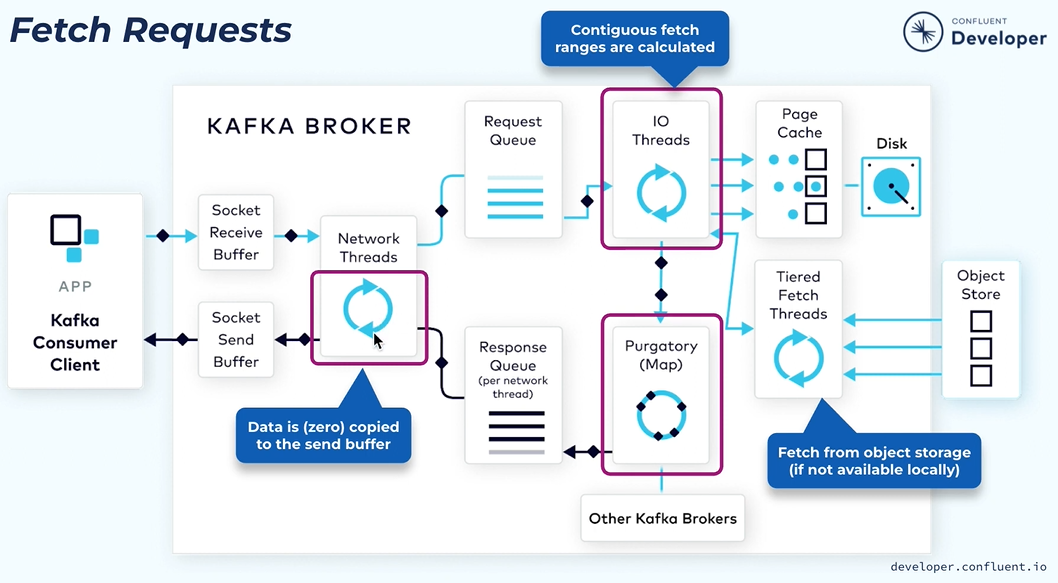
The consumer client when it sends the fetch request it will specify the topic on the partition it wants to fetch the data and also the starting offset where the data needs to be retrieved.
The fetch request will similarly go through the brokers received buffer then it will be picked up by the network thread then fetch request will be put into a shared request queue.
The IO thread will do use the index structure to find the corresponding file byte range using the offset index.
In some cases there might be a topic which has no new data in that case keeping returning and result with empty response to the consumer is waste and it is not efficient so in this case the consumer can specify a minimum number of bytes it needs to wait for the response and the maximum amount of time it can afford to wait.
If there is not enough data similar to the producer request the fetch request will be put into the purgatory structure and wait for enough bytes to be accumulated.
When enough amount of data will be accumulated then it will be given to the response cube from there the network thread will pick it up and send the actual data response back to the client.
In Kafka we use zero copy transfer in the network thread to transfer the range of bytes from the underlying file directly to the remote socket. It is efficient for the memory management.
The process is fast as the data will be still in the page cache and then copying data from memory to the socket buffer is very fast.
Producer Client Hands On.
Producing event to a kafka topic.
Cluster name perf-test-cluster.
Create a topic perf-test-topic.
We also need to create a client configuration file for the cluster that will be needed by the kafka-producer-perf-test command during the exercise.
In cluster Overview click on configure a client.
Creation of a configuration file using the Confluent Cloud Console Java client configuration section. The configuration file include the cluster endpoint that will be used by a performance test script to establish a connection with the cluster.
The config file also has the authentication settings.
cat java.config The cluster end point and the authentication settings.
Producer client performance using the default producer configuration values.
Two most important settings related to event throughput and latency are linger milliseconds and batch size.
The linger setting is the maximum amount of time the producer will wait while adding events to a record batch before it is drained.
The batch size setting is the maximum size of the batch it can be before it flushed. The defaults for the settings are zero about 16kb.
Altering this value will change the average throughput and latency
kafka-producer-perf-test \
    --producer.config /home/training/java.config \
    --throughput 200 \
    --record-size 1000 \
    --num-records 3000 \
    --topic perf-test-topic \
    --producer-props linger.ms=0 batch.size=16384 \
    --print-metrics | grep \
"3000 records sent\|\
producer-metrics:outgoing-byte-rate\|\
producer-metrics:bufferpool-wait-ratio\|\
producer-metrics:record-queue-time-avg\|\
producer-metrics:request-latency-avg\|\
producer-metrics:batch-size-avg"
The record size to 1000 bytes and specify that the test run through 3000 records with a throughput of 200.
The most important property is the producer props where we set the lingers and batch size. The print metrics file to output the metrics limiting the output using grep.

Beverage batch size was one to 1215 Which is much lower than the default batch size. Next slide
It is explained by the linger valley which was set to zero as the lingerie so low the batch is being flushed almost whenever the first report is added.
The record size is 1000 and one record is being added to each batch before linger triggers the Flash.
The buffer-pool-wait-ratio set to 0 value indicates that batches are never waiting on previously sent request meaning the Confluent cloud broker is processing each and every request as fast as they were sending them.
Outgoing-byte-rate and request latency average shows the throughput and the latency result .
The records queue time shows how long the recorder remaining in the batch priority beam flushed.
Lets increase the linger from 0 to 100 milliseconds Giving records more time to be added to a batch before it is flushed.
kafka-producer-perf-test \
    --producer.config /home/training/java.config \
    --throughput 200 \
    --record-size 1000 \
    --num-records 3000 \
    --topic perf-test-topic \
    --producer-props linger.ms=100 batch.size=16384 \
    --print-metrics | grep \
"3000 records sent\|\
producer-metrics:outgoing-byte-rate\|\
producer-metrics:bufferpool-wait-ratio\|\
producer-metrics:record-queue-time-avg\|\
producer-metrics:request-latency-avg\|\
producer-metrics:batch-size-avg"
Lingers set to 100 mini average batch size is much higher. It indicates that the batch size is triggering the batch to be flushed. It is just lowered than the batch size mentioned.
Its throughput is also decreased and latency increased. We don’t want it.

Now increasing the batch size to 300,000.
kafka-producer-perf-test \
    --producer.config /home/training/java.config \
    --throughput 200 \
    --record-size 1000 \
    --num-records 3000 \
    --topic perf-test-topic \
    --producer-props linger.ms=100 batch.size=300000 \
    --print-metrics | grep \
"3000 records sent\|\
producer-metrics:outgoing-byte-rate\|\
producer-metrics:bufferpool-wait-ratio\|\
producer-metrics:record-queue-time-avg\|\
producer-metrics:request-latency-avg\|\
producer-metrics:batch-size-avg"
The average batch size has increased but not that much that indicates that the linker settings isn’t allowing enough time for batches to reach the limits set by the batch size parameter.
Throughput and latency also in the wrong place

Increasing the linger time to 1500 milliseconds.
kafka-producer-perf-test \
    --producer.config /home/training/java.config \
    --throughput 200 \
    --record-size 1000 \
    --num-records 3000 \
    --topic perf-test-topic \
    --producer-props linger.ms=1500 batch.size=300000 \
    --print-metrics | grep \
"3000 records sent\|\
producer-metrics:outgoing-byte-rate\|\
producer-metrics:bufferpool-wait-ratio\|\
producer-metrics:record-queue-time-avg\|\
producer-metrics:request-latency-avg\|\
producer-metrics:batch-size-avg"
The batch size is close to the batch size limit. Still losing the throughput and latency.

The producer default for the lingering batch size are actually the best choice for an application where it produces 200 records for per second of 1000 bytes each.
Data Plane - Replication Protocol.
How Kafka replicates the data in the data plane?
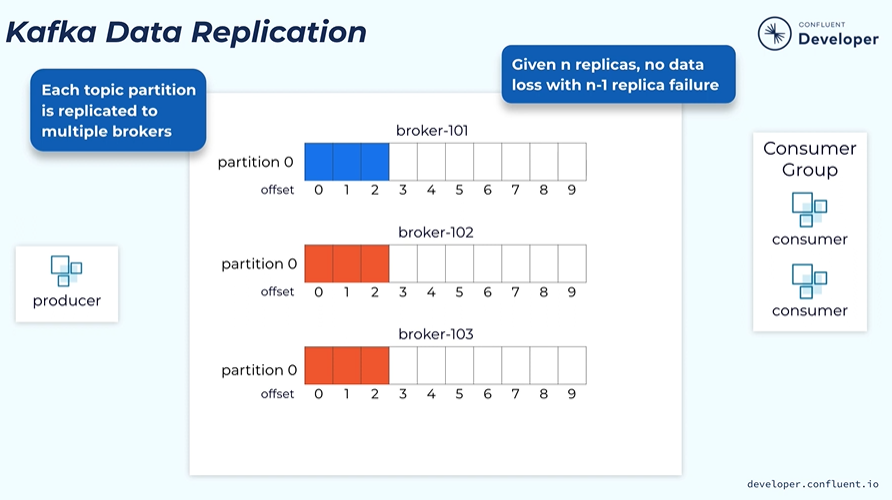
When create a topic we specify how many replication we need. Then all the partitions within the topic will be created with the number of replicas.
The replication as N then we can tolerate N-1 failures.
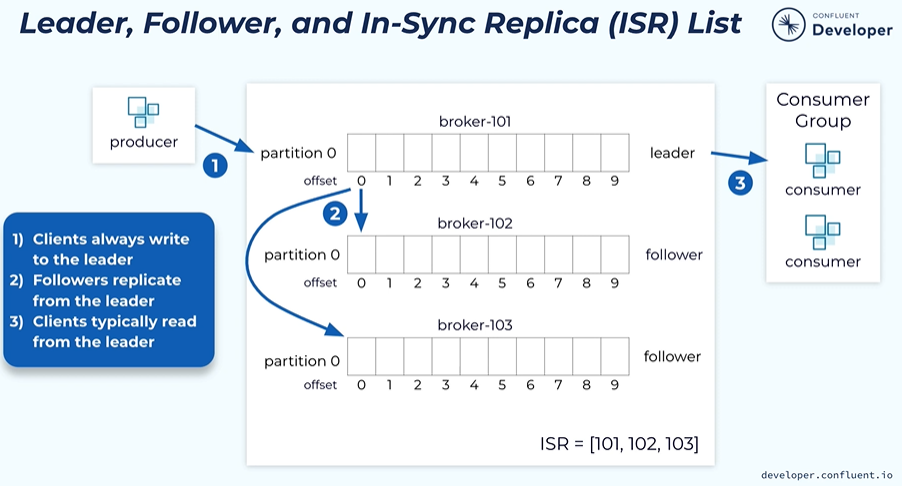
The producer will send the data to the leader. The followers will retrieve the data from the leader. The consumer reads the data from the leader. It can be configured to read the data from the followers.
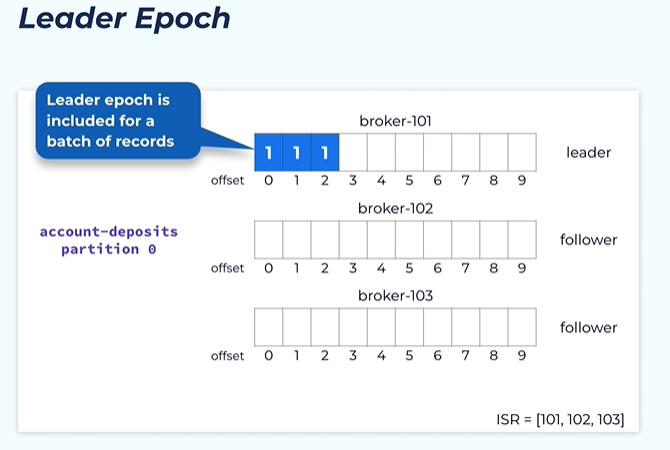
In-sync Replicas ISR - ISR is a set of data that captures all of the replicas that have fully caught up with the leader. Where all the replicas are healthy then all the replicas will be a part of the ISR.
Each of the leader is also associated with the leader epoch. It is a unique number that is monotonically increasing and is used to capture the generation of the lifetime of a particular leader.
Every time when a leader takes the data From the producer request To write to the local blog it needs to cheque all the records of dispatch with its leader epoch.
Leader epoch is very important for doing log reconciliation among all the replicas.
When the leader has appointed the produced attendant to the local locks all the followers will be trying to retrieve the new data from the leader the follower does that by issuing a fetch request to the leader including the offset from which it needs to fetch data.
After the leader receives the rental request the leader will be returning the new records from the particular offset to the follow.
When the following receives the response it will be appending those new records into its own local log.

The follower is appending the data to its local log it keeps the same leader epoch included in those record batches.
We need a way to commit the offsets, those records have been considered safe.
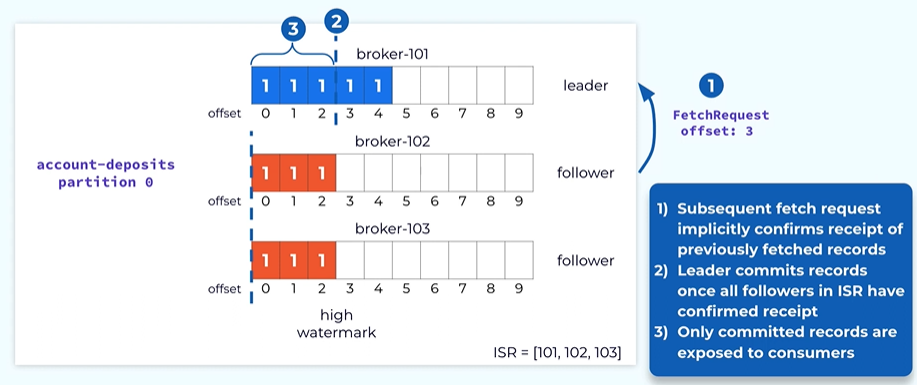
In Kafka, The way we commit those records is defined by once a particular record is included in all the in sync replicas then the record is considered committed and it can be safely written to the consumer.
How does the leader know weather a particular follower has received a particular order ?
It is actually piggybacked on the fetch request from the follower.
By sending a fetch request from a particular offset say here offset three the leader knows that the follower has received all the records up to of set 3.
The way we model committed records is through this concept called high watermark it was the opposite before which all the records are considered as committed in this case we will mark the high Watermark on the leader to offset three after the fetch request have gone through all the offset up to 3.
Once the leader has advanced the high Watermark it will also need to propagate this information to the followers this is done by piggybacking in the fetch response.
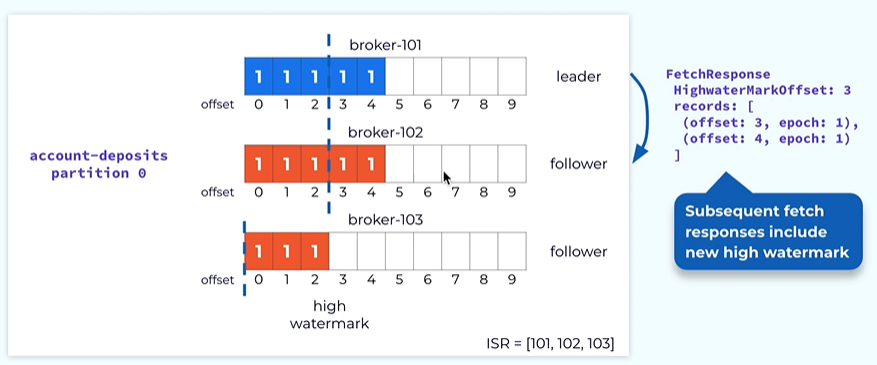
In the future response leader will also include the latest high Watermark to the follower. It is done asynchronously the lowers high watermark typically is a little behind the true high water mug of the leader.

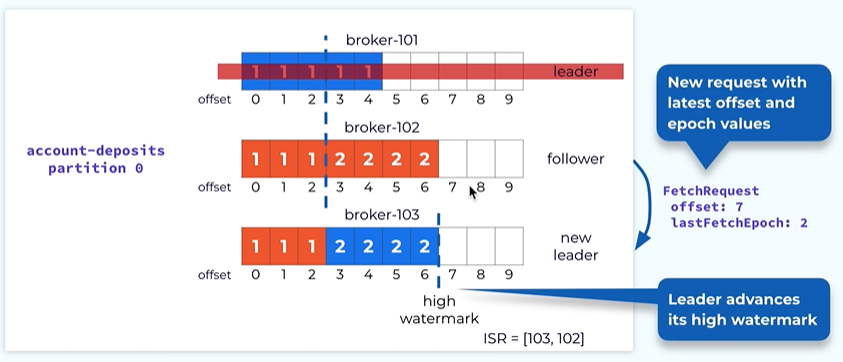
Let’s say the leader broker one on one is failed we need a way to elect the new leader.
The leader election in Kafka in the data plane is very simple because through the protocol we know all the replicas that are in the isr.
All those instinct replicas have all the previously committed records.
In this case both controller 102 and 103 can be a leader so we can pick 103 as a leader.
This information will be propagated to the control plane once replica 103 notices that it’s a new leader and it will start take the new request from the producer.
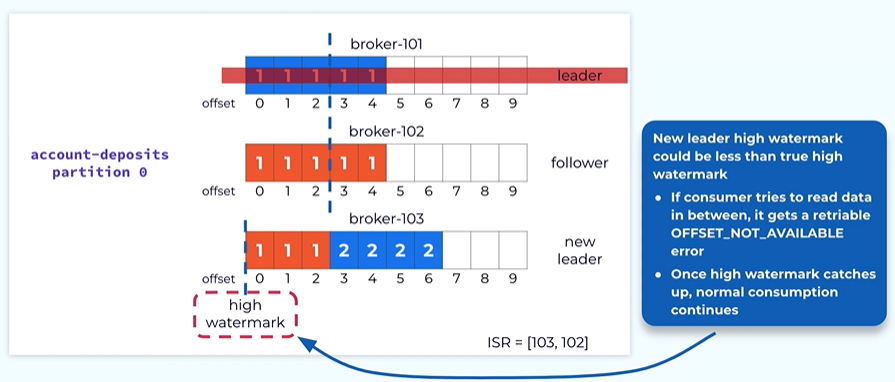
Once the new leader is elected the high watermark the new leader is actually less than the true high watermark in the previous leader.
What will happen if a consumer is issuing a fetch request in this time window asking for offset in the middle offset 1?
In this case we dont want to give the consumer the wrong indication that its request is invalid because this is transient and temporary.. We will be issuing a retrial error back to the consumer client so that it can keep retrying until its high watermark catches up to the true high water mark.
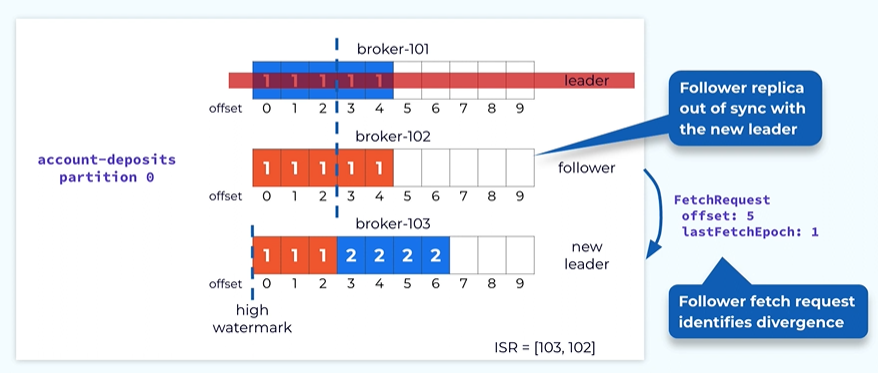
Once the new leader is elected some of the followers may need to reconcile their data with a new leader.
The follower on the broker 102 actually has some data in offset 3 and 4. Those are the records that are never committed and They are actually quite different from the corresponding record in the new leader.
We need a way to clean those records. This is done through the replica reconciliation logic. It is done through the detail in the fetch request. When the follower is issuing effect request in addition to the offset firm which it wants to fetch data it also includes the latest epoch it has seen in its local logs.
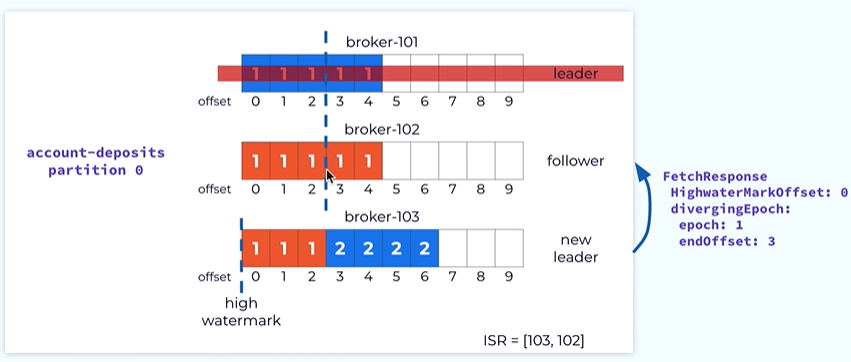
In this case it is epoch 1, Once the leader receives the fetch request it will use the epoch information to cheque the consistency with its local log In this case it realizes that within its local log epoch 1 really ends at offset 2 instead of offset 4 indicated by the follower.
So the leader will send a response indicating to the followers to make the log consistent with respect to epoch 1. in this case epoch I really ends before offset 3. When the following receives this fetch response from the leader it will know that it needs to truncate the data at the after 3 and four at this point and at this point the data is consistent with the leader up to offset 2.
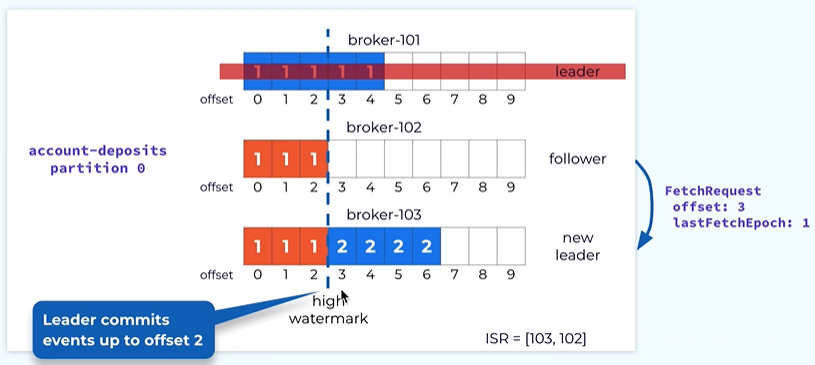
Now the follower issue the next fetch request starting offset 3 and the last epoch 1.
Once the leader receives it it notices that it is actually consistent with the local log s and this will causeway its local high watermark to be advanced to offset 3.
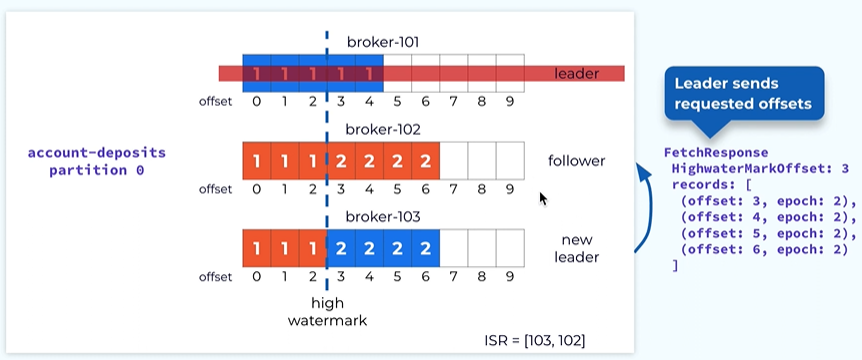
Now the leader will be returning new data back to the follower and the follower will take this data and append to its local log.
Follow will fetch again with the latest offset or offset 7 and this will cause the high watermark in the leader to be advanced to offset 7.
There is complete reconciliation between the followers log and the leaders log.
At this point we’re still under the replicated mode Because not all the replicas are in ISR.
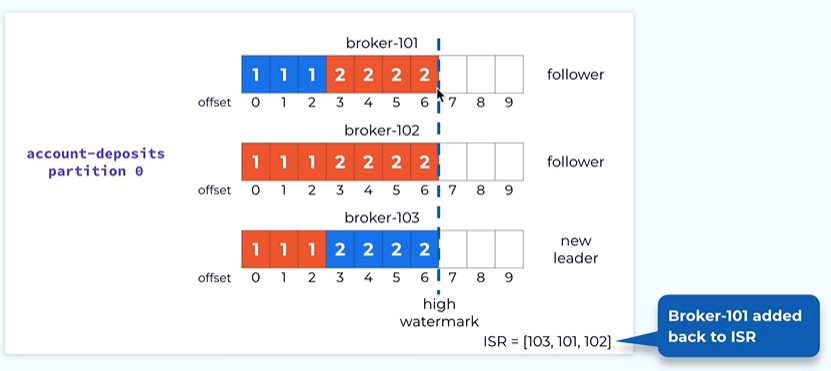
At some point the failed replica or broken 101 Will come back and it will catch up from the leader and will go through the same reconciliation logic as replica 102 and eventually it will catch up all the way to the end of the logs and then it will be added back to the isr.
Now we’re into the fully replicated mode.
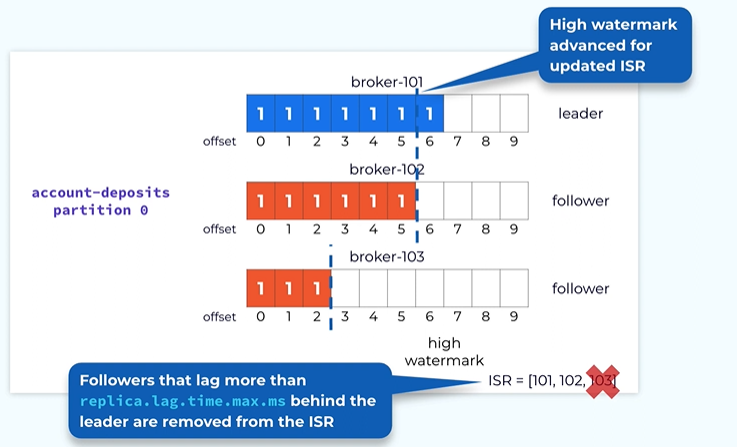
How follower failures is handled?
Sometimes the father can fail or may be slow to catch up with the leader in that case we keep on waiting for the follower then we will never be able to advance the high watermark.
The leader will keep monitoring the progress of the follower and it will measure what’s the last time this particular follower has caught up all the way with the leader and if it is lagging by more than a configured amount of the time based on the property then this follower is considered as out of sync. It will be dropped out of ISR. At that point the leader can now advance the high Watermark based on the reduced in sync replica set.
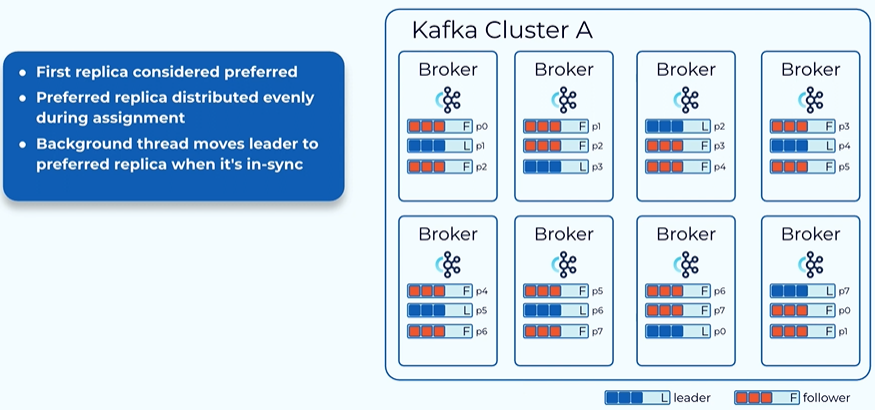
Balancing the load of the leader.
The leader replica typically has a little bit more than the following because all of the followers are fetching data directly from the later so in a healthy cluster we want the load of the litter to be balanced this is a concept called preferred replica when you create a topic we designate the first replica of each partition as a preferred replica.
When we assign the preferred replica we try to assign it such a way that the preferred replica will be distributed evenly among all of those brokers.
When we do the leader in election we try to . Added to see if the preferred replica is healthy and if the current leader is on the preferred one if not we try to move the leader back to the preferred replica. So in the end all the leader to be moved into the preferred replica.
Next slide this is a revenue distributed among all the brokers so we can achieve a balanced load among the leaders in the cluster.