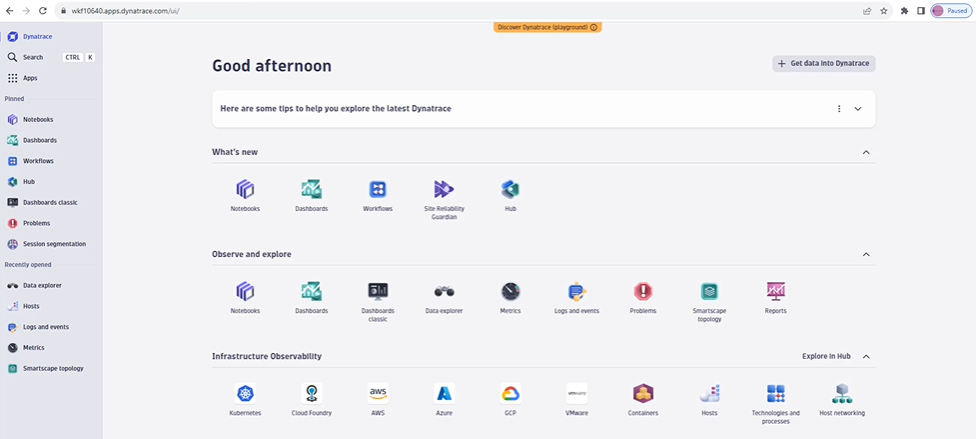
Introduction
Classic View.
Deploy one agent into the infrastructure. Then look into the option available in the Infrastructure Observability.
Learn to use the Dynatrace Query Language.
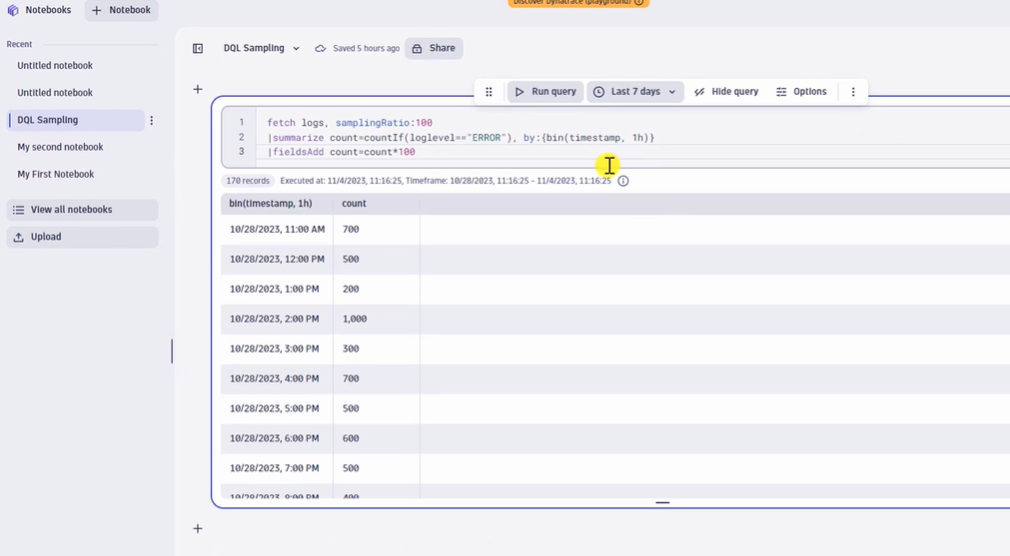 Create own metrics and dashboard.
Deploy Dynatrace one Agent.
Deploy the dynatrace and the host is the environment where collect the information.
Deploy Dynatrace and then we need to install Dynatrace OneAgent.
OneAgent is the software that will send the data to the dynatrace. The host can be window or kubernetes. Then it will tell the step to install oneAgent in kubernetes.
In the Deploy Dynatrace there will be agent.
Get the host deploy the dynatrace.
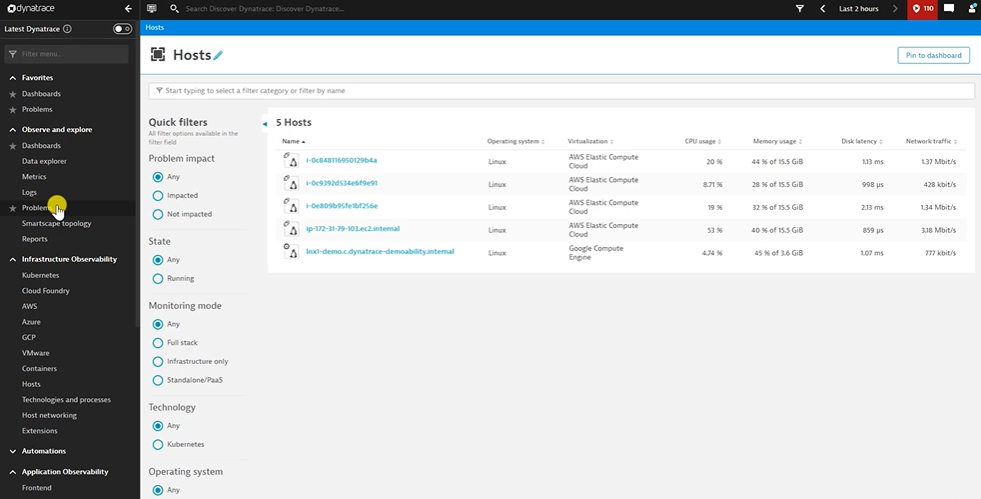
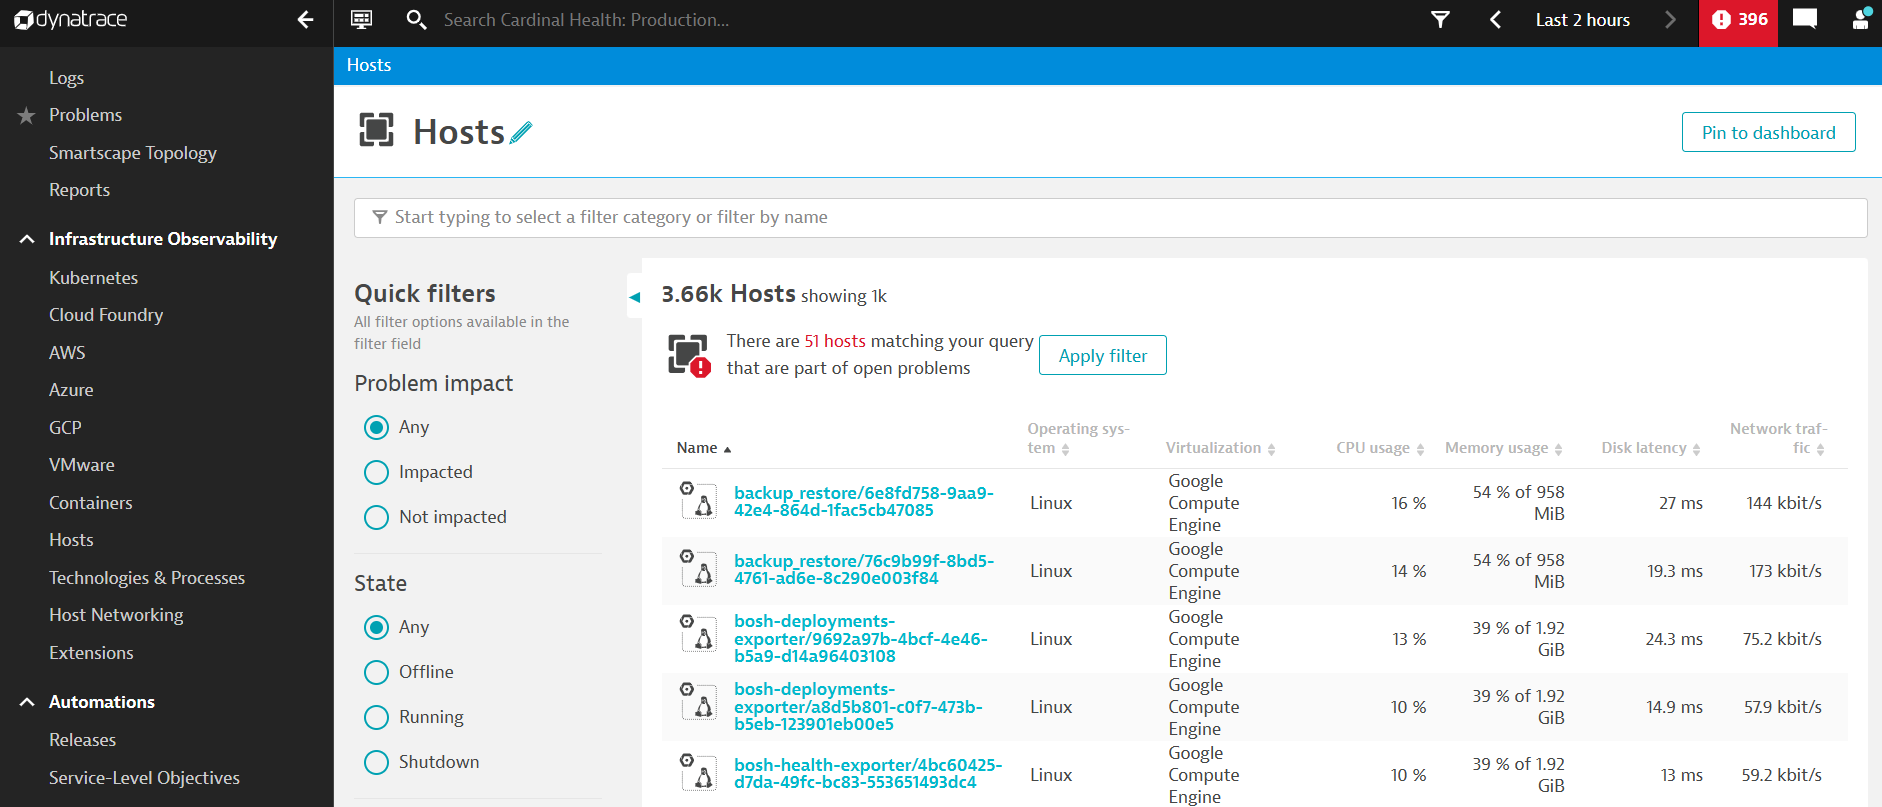
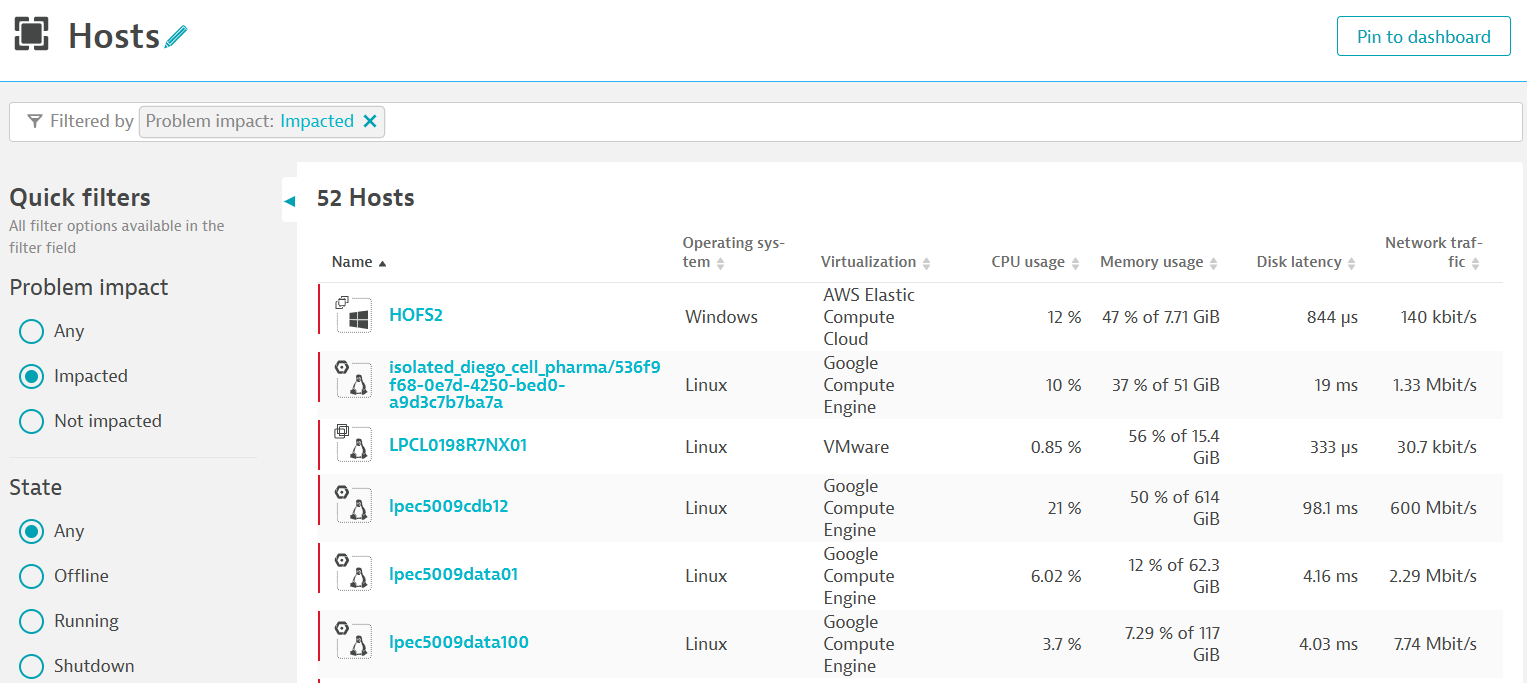
In the Infrastructure Observability - Hosts. It will show the host that we have deployed the dynatrace.
Any issue it will show here and we can set the time range in the top.
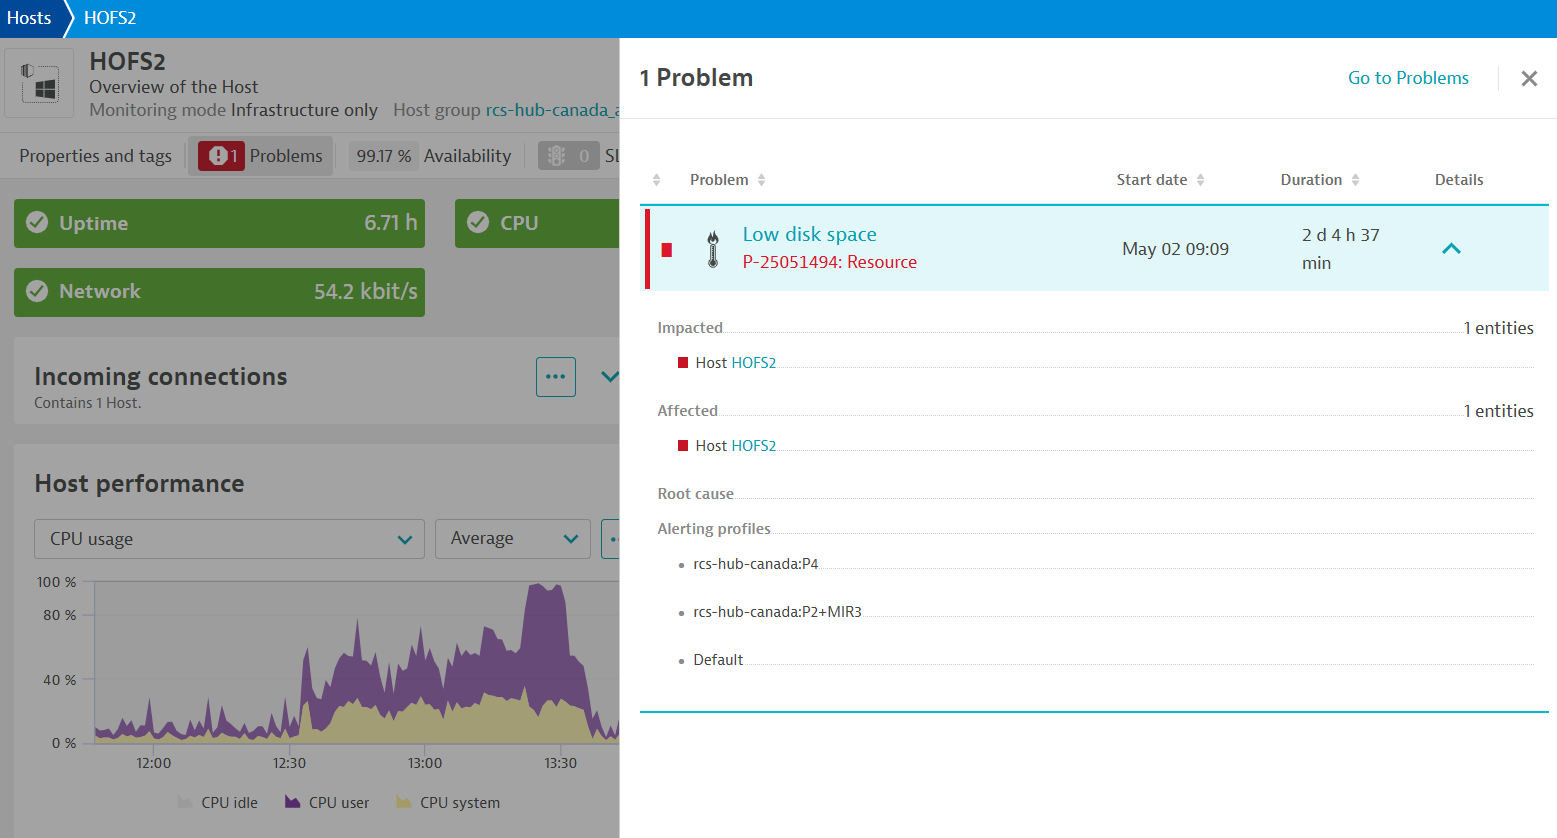
 There we can see problems. The CPU saturation problem in the host level and the cpu usage problem appear after the threshold level.
 Any issue we can see the graph when it is high and generally it comes to low after sometime.
Types of Dynatrace Problem Monitoring.
There are 11 resource events that dynatrace trigger.
Dynatrace will report the events. Also there is custom events.
Say one service will be down for an hour for maintenance. In that case we can set a maintenance window. Settings - Maintenance Window - Maintenance alerting and availability. It is important when there is weekly maintenance in the host and ops team donot recieve any alert that is not a problem.
Settings - Monitoring - Monitored technologies - Monitor log monitoring on every host.
Full Stack and Infrastructure only monitoring - Dynatrace monitor hosts through one Agent. OneAgent is licenced on per host basis and all host are not of equal size. The number of credit will be consumed depends on the monitoring mode like full stack monitoring mode or the infrastructure monitoring mode.
Settings - Monitoring - Monitoring overview - There will be one host - Edit and see the enable options.
When the full stack monitor is off then it will only monitor the infrastructure. No user application data and it will consume less data.
There we can clone any dashboard and change any property. Select the data explorer option and change the query.
In the observe and explorer - Dashboard - Create Dashboard.
CPU Usage.
Get the graph and the data explorer. There set up available like host, kubernetes, database. The CPU utilization is available in Host.
System Up Time.
Select the graph and host and the Host Availability.